
Have you ever sat at your kitchen table in Manchester with a hot cup of tea, staring at an online calorie tool and asking yourself: “What should my BMR actually be?” You are not alone. Many people search for the average basal metabolic rate expecting a single, magic number that fits everyone. But resting energy needs vary widely based on your body size, composition, age, and biological traits. Your basic resting energy need is also quite different from your total daily calorie needs.
- BMR is the energy your body needs to maintain essential functions at complete rest.
- Average values are useful for general context, but not as a personal health target.
- A calculator gives a mathematical estimate; it does not measure metabolism directly inside your body.
If you have used a BMR calculator, an RMR calculator, a TDEE calculator, or a daily calorie calculator, you know how confusing the results can feel. Searching for an “average” can easily mislead you if you expect your body to match a generic internet formula. Is your BMR low, high, or simply normal for your unique frame? Let us look at how these numbers work in real life.
What Is the Average Basal Metabolic Rate?
Before comparing numbers, we must define what BMR is. Treating an average calorie figure as an exact target for every adult is a common mistake.
What Does Basal Metabolic Rate Mean?
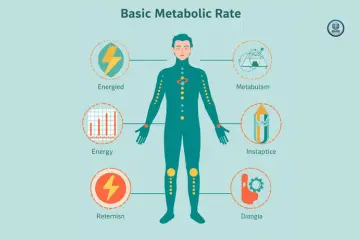
In simple terms, your basal metabolic rate is the energy needed to keep vital processes running under strict resting conditions. The National Academies defines BMR as energy expenditure under complete physical, mental, and digestive rest. It covers:
- Breathing
- Heart function
- Brain activity
- Organ function
- Cellular maintenance
- Temperature regulation
- Basic homeostasis
What Is a Typical Adult BMR?
Population broad ranges offer general context. Published clinical references give rough averages of 1,300 to 1,500 kcal per day for adult women and 1,600 to 1,800 kcal per day for adult men. These figures are broad population estimates, not personal targets. Body size, height, and muscle mass shift BMR substantially, so there is no single ideal BMR.
Average BMR Is Not the Same as Average Daily Calorie Needs
This distinction is crucial. Many people search for BMR when they really want their full daily calorie requirement. The NHS gives broad average daily calorie guidance of around 2,500 kcal for men and 2,000 kcal for women. These figures include daily movement and digest energy, so they are not BMR figures.
Average BMR for Men and Women
Sex differences in average BMR stem largely from differences in body size and lean tissue mass. The National Academies notes that body composition, particularly fat-free mass, is a primary driver of resting energy expenditure.
The table below contrasts general adult group averages with the key factors that cause individual variations.
| Adult group | Broad average BMR range | What can shift it? |
| Women | ~1,300–1,500 kcal/day | Size, age, lean mass, health |
| Men | ~1,600–1,800 kcal/day | Size, age, lean mass, health |
| Individual adult | Highly variable | Body composition and physiology |
Why Men Often Have a Higher Average BMR
Men often show a higher average BMR because of larger average body size and higher total fat-free mass. Research reviews consistently identify lean mass as a key predictor of resting energy expenditure.
Why Women Can Have a Higher BMR Than Some Men
Individual variation often overrides group averages. A taller woman with high lean mass can easily have a higher BMR than a smaller, less active man. Key individual factors include:
- Height
- Weight
- Fat-free mass
- Muscle mass
- Age
- Individual physiology
Why Average Figures Can Be Misleading
An average is simply a statistical midpoint, not a biological goal. Comparing your personal calculator output to a generic internet average causes unnecessary worry.
Average Basal Metabolic Rate by Age
Age influences energy needs, but metabolism does not drop sharply overnight on any specific birthday.
The table below outlines expected BMR patterns across life stages.
| Age group | Expected BMR pattern | Main context |
| Children | Generally high relative to size | Growth and development |
| Teenagers | Changing rapidly | Growth and puberty |
| Young adults | Relatively stable | Body size and composition matter |
| Middle age | Gradual changes | Activity and body composition |
| Older adults | Often lower | Changes in lean mass and organ metabolism |
BMR in Your 20s
Resting metabolic rate is relatively high in young adulthood due to peak muscle mass and active organ tissue, though variation remains wide.
BMR in Your 30s and 40s
Turning 30 does not automatically stall your metabolism. Changes during these decades are usually tied to shifts in physical activity, lifestyle, and muscle mass.
BMR in Your 50s and 60s
During your 50s and 60s, subtle reductions in fat-free mass and routine movement lower overall resting expenditure slowly.
BMR After 70
Older age is linked with lower average resting energy expenditure. Reductions in fat-free mass and subtle shifts in organ metabolism account for most of this change.
Does Your Metabolism Suddenly Slow at 30?
No. Recent large-scale metabolic studies show that resting expenditure stays remarkably stable through early and mid-adulthood. It does not drop off a cliff at age 30.
Average BMR by Body Size
Two people of the same age can have vastly different BMRs if their physical size and tissue types differ.
Height and BMR
Height increases total body surface area and tissue volume. Taller frames require more baseline energy to support basic biological functions.
Weight and BMR
Total body mass requires energy to maintain. Heavier bodies generally have higher baseline energy needs than lighter bodies.
Muscle Mass and Fat-Free Mass
Fat-free mass includes muscle, bone, organs, and fluids. It is a dominant predictor of resting energy expenditure. The National Academies reports that fat-free mass accounts for 60% to 80% of individual variance in resting energy expenditure.
Why Body Fat Alone Does Not Tell You Your BMR
Fat tissue is metabolically active, but it uses far less energy per kilogram at rest than lean organs and muscle tissue.
Average BMR vs Resting Metabolic Rate
See BMR, RMR, and REE are often used interchangeably, but key technical differences exist.
BMR vs RMR
BMR measurement requires strict conditions: complete overnight fasting, resting immediately upon waking, and zero movement. RMR is measured under less rigid resting conditions during the day. In practice, the numbers are very close.
BMR vs REE
Resting energy expenditure (REE) is a term often used in clinical research settings and is functionally equivalent to RMR.
How Much Higher Is RMR Than BMR?
The National Academies notes that RMR or REE values run roughly 10% higher than strict BMR due to minor muscle tone and digestive effects.
Average BMR vs Total Daily Energy Expenditure
Mistaking BMR for total daily energy needs is a very common error.
What Is TDEE?
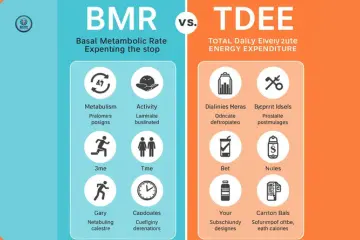
Total Daily Energy Expenditure (TDEE) is the total amount of energy your body burns across a full 24-hour period.
The Main Parts of Daily Energy Expenditure
The National Academies identifies three core components of daily expenditure:
- Resting energy expenditure
- Thermic effect of food
- Physical activity
Why TDEE Is Usually Higher Than BMR
Once you get out of bed, movement, digestion, work, walking, and exercise add substantial calorie expenditure on top of your resting BMR baseline.
Average BMR and Daily Calorie Needs
Using a BMR calculation as a daily food intake goal is an improper use of the metric.
The table below contrasts common health metrics and their appropriate practical applications.
| Measure | Rough meaning | Example use |
| BMR | Resting energy requirement | Metabolic baseline |
| RMR | Resting energy expenditure | Nutrition assessment |
| TDEE | Whole-day energy expenditure | Maintenance calorie estimate |
| Food intake | Energy consumed | Diet planning |
Why You Should Not Eat Only Your BMR
Eating only your BMR calories starves your body of energy required for daily movement, work, and digestive processing.
Average Daily Calories Are Not BMR
NHS guidance of 2,000 to 2,500 kcal per day accounts for routine daily living. BMR covers only resting organ survival.
BMR as the Starting Point for a TDEE Calculator
A BMR estimate serves as the starting baseline. You then multiply it by an activity factor to estimate your actual TDEE.
How to Calculate Your BMR
Understanding how predictive formulas estimate BMR helps prevent treating the output as an exact internal measurement.
Mifflin-St Jeor Equation
The Mifflin-St Jeor equation is widely regarded as one of the most reliable predictive equations for adult resting energy expenditure.
Mifflin-St Jeor Formula for Men
BMR = (10 x weight in kg) + (6.25 x height in cm) - (5 x age in years) + 5
Mifflin-St Jeor Formula for Women
BMR = (10 x weight in kg) + (6.25 x height in cm) - (5 x age in years) - 161
Harris-Benedict Equation
The older Harris-Benedict formula often estimates higher BMR values. Differences between online calculators usually stem from which formula they use.
Why Different BMR Calculators Give Different Numbers
Calculators vary due to:
- Different underlying equations
- Equation revisions
- Unit rounding rules
- User input errors
- Varying population assumptions
Which BMR Equation Should You Use?
No single equation fits every individual perfectly. Mifflin-St Jeor offers solid general accuracy for non-athletic adults.
Worked Example: Finding an Average BMR
Let us work through a clear calculation using a fictional profile.
Example Person
- Age: 35
- Height: 175 cm
- Weight: 70 kg
- Sex: Female
- Activity: Desk job (evaluated separately)
Calculate the Estimated BMR
Using the Mifflin-St Jeor formula for women:
- Weight step:
10 x 70 = 700 - Height step:
6.25 x 175 = 1,093.75 - Age step:
5 x 35 = 175 - Base math:
700 + 1,093.75 - 175 - 161 = 1,457.75
Estimated BMR is approximately 1,458 kcal per day.
Compare the Result With a Broad Average
This 1,458 kcal figure falls directly into the standard 1,300 to 1,500 kcal broad population average for women.
Turn BMR Into an Estimated TDEE
Multiplying this BMR by a light activity factor (1.375) yields an estimated TDEE of roughly 2,005 kcal per day for daily maintenance needs.
What Factors Affect Your BMR?
Your BMR is shaped by several biological and physiological variables beyond simple age and sex.
Fat-Free Mass
Metabolically active tissues like organs and muscle demand continuous energy supply even during deep sleep.
Body Size
Larger frames feature greater organ mass and larger cellular volume, raising baseline energy requirements.
Age
Gradual age-related changes in body composition can cause baseline resting energy requirements to decline over decades.
Sex
Differences in skeletal size and muscle-to-fat ratios drive population-level variance between sexes.
Genetics
Inherited physiological traits account for subtle metabolic variations between individuals of identical size.
Hormones and Thyroid Function
Thyroid hormones directly regulate cellular energy production. Fluctuations in hormone levels alter resting expenditure.
Illness, Fever and Recovery
Fever, infection, and physical injury cause metabolic demand to spike as the body repairs damaged tissue.
Environment and Temperature
Extreme cold or heat forces the body to expend additional energy maintaining core internal temperature.
Energy Restriction and Weight Loss
Prolonged severe calorie cuts can trigger adaptive responses that slightly decrease resting metabolic output.
What Is a “Good” or “Normal” BMR?
There is no single “good” BMR number. An appropriate BMR simply reflects your individual physical structure accurately.
Is a Low BMR Bad?
No. A lower BMR often simply means you have a smaller body frame or less overall weight to support.
Is a High BMR Good?
No. A higher BMR usually means a larger body or higher total body mass, not superior internal health.
How to Interpret a BMR Below the Average
If your BMR falls below broad average tables, evaluate your height, weight, and muscle frame before suspecting issues.
How to Interpret a BMR Above the Average
A higher result generally aligns with taller height, heavier body mass, or greater muscle tissue.
When a BMR Result Deserves Professional Attention
Online tools cannot diagnose metabolic health. Unexplained weight loss, severe fatigue, or drastic body changes require consultation with a GP or qualified healthcare professional.
Average BMR by Sex, Age and Body Size — Quick Reference
The summary table below outlines how key physiological factors impact baseline metabolic trends.
| Factor | General BMR pattern |
| Larger body size | Usually higher |
| Greater fat-free mass | Usually higher |
| Older age | Often lower |
| Greater physical fitness/lean mass | Can raise resting energy needs |
| Illness or physiological stress | May alter energy expenditure |
| Individual genetics | Can contribute to variation |
Why There Is No Single Average BMR
Because fat-free mass and body size vary greatly across humans, a single average value cannot define individual health accurately.
How Accurate Are BMR Calculators?
Understanding the line between predictive tools and clinical measurement helps set realistic expectations.
Calculator Estimate vs Measured BMR
Calculators use population statistics to guess BMR. True measurement requires indirect calorimetry to analyze gas exchange directly.
Indirect Calorimetry
Indirect calorimetry measures oxygen used and carbon dioxide produced while a person rests quietly in a controlled lab setting.
Why Your Calculator May Be Off
Calculator estimates may deviate due to:
- Unique muscle-to-fat ratios
- Specific age anomalies
- Extreme BMI categories
- Individual metabolic variation
What a High-Quality BMR Tool Should Tell You
A dependable BMR calculator should clearly state:
- The exact equation used
- Required input parameters
- Used measurement units
- That results are estimates
- No claims of measuring internal metabolism directly
BMR Calculator vs RMR Test
Comparing home calculators to professional lab testing helps clarify when direct testing is necessary.
The table below compares digital calculators against laboratory testing methods.
| Feature | BMR Calculator | RMR/REE Test |
| Cost | Usually free/low cost | Usually paid |
| Convenience | Very high | Lower |
| Uses body measurements | Yes | Yes |
| Measures respiratory gases | No | Usually |
| Personalised | Estimated | More directly measured |
| Suitable for everyday planning | Yes | Sometimes useful |
| Exact for every person? | No | Measurement still depends on protocol |
When a Calculator Is Enough
For general diet planning, weight management, or personal curiosity, a standard online equation is entirely sufficient.
When Testing May Be More Useful
Clinical metabolic testing is useful for elite athletes, severe clinical weight management, or medical recovery settings.
Worldwide Expert Advice on Average BMR
Solid metabolic information relies on verified scientific literature rather than online hype.
What the National Academies Evidence Shows
The National Academies 2023 energy expenditure reviews state that resting metabolic rate makes up 60% to 70% of total daily energy output.
Why Fat-Free Mass Matters So Much
Classic research by J. J. Cunningham demonstrated that lean body mass is the single strongest predictor of resting metabolic rate in adults.
“Fat-free mass accounts for the vast majority of individual variation in resting metabolic rate.” — J. J. Cunningham, American Journal of Clinical Nutrition
A Real-Life UK Example: Checking BMR on a Normal Day
Picture a typical weekday morning in London. You sit down with a cup of tea, open a laptop, and plug your details into a BMR calculator. Here is how metabolic energy expenditure breaks down across that day:
7:00 AM — Before Breakfast
As you wake up, your body is burning calories at its baseline rate just keeping your heart beating and organs functioning.
8:00 AM — Coffee and the School or Work Commute
Walking to the train station or driving to work adds physical activity expenditure on top of your resting BMR rate.
1:00 PM — Lunch
Eating lunch triggers the thermic effect of food. Your digestive system burns energy breaking down nutrients.
6:00 PM — Gym, Walk or Sofa
Your evening choices determine your total TDEE. Exercising or walking sharply increases daily energy output compared to resting.
The Slightly Annoying Truth
A static online calculator cannot see your daily movement. It provides a static starting baseline, not an active tracking device.
Common Average BMR Mistakes
Avoid these common misconceptions regarding metabolic rates:
“Everyone Should Have a BMR of 1,500 Calories”
False. Ideal BMR varies widely based on individual body size, height, age, and sex.
“A Low BMR Means Your Metabolism Is Broken”
False. A lower BMR usually indicates a smaller body frame or lighter body mass.
“A High BMR Means You Are Healthier”
False. Higher BMR values often reflect larger body weight rather than superior fitness.
“BMR Equals the Calories You Should Eat”
False. BMR covers only resting survival needs. Daily food targets must account for movement and activity.
“BMI Tells You Whether Your BMR Is Healthy”
False. BMI measures weight relative to height; it does not measure metabolic expenditure.
“You Can Precisely Increase BMR With One Food”
False. No single food or drink permanently alters your baseline metabolic rate.
Average BMR vs BMI vs TDEE
Distinguishing between common health metrics prevents confusion when planning calorie goals.
The comparison table below details the roles of popular metabolic assessment tools.
| Tool | Measures | Main question | Result |
| BMI calculator | Weight relative to height | What is my weight category? | BMI score |
| BMR calculator | Resting energy | How much energy do I use at rest? | kcal/day |
| TDEE calculator | Daily energy expenditure | How much might I use each day? | kcal/day |
| RMR test | Measured resting energy | What is my measured resting expenditure? | kcal/day |
Why These Numbers Should Not Be Mixed Up
Each metric evaluates a distinct physical property. Conflating BMR with TDEE leads to underfueling your daily energy needs.
How to Use an Average BMR in a Calorie Calculator
Follow this structured process to apply BMR data safely:
Step 1 — Enter Accurate Measurements
Use recent, accurate measurements for your age, height, and body weight.
Step 2 — Check the Equation
Ensure the tool relies on verified models like the Mifflin-St Jeor formula.
Step 3 — Record Your BMR
Treat your calculated output as an initial statistical estimate.
Step 4 — Estimate TDEE
Apply an appropriate physical activity multiplier to estimate whole-day calorie needs.
Step 5 — Compare With Real-World Trends
Adjust your calorie intake over time based on actual body weight changes rather than calculator predictions alone.
When to Recalculate
Recalculate your baseline estimates when experiencing:
- Significant weight change
- Major changes in physical activity
- Starting new workout routines
- Lifestyle or employment shifts
Frequently Asked Questions About Average Basal Metabolic Rate
What is the average basal metabolic rate for adults?
Broad average ranges run around 1,300 to 1,500 kcal per day for women and 1,600 to 1,800 kcal per day for men.
What is a good BMR for a woman?
There is no universal target number. A healthy BMR aligns naturally with your specific body size and composition.
What is a good BMR for a man?
A good BMR reflects a person’s physical stature, muscle mass, and age accurately rather than hitting a specific figure.
Is a BMR of 1,200 calories too low?
A 1,200 kcal BMR can be completely normal for a smaller or shorter adult woman.
Is a BMR of 1,500 calories normal?
Yes. A 1,500 kcal BMR aligns well with standard adult population averages.
Does BMR decrease with age?
Average resting energy expenditure decreases slowly over adulthood due to shifts in body composition and muscle mass.
Does muscle increase BMR?
Greater lean tissue mass increases resting metabolic expenditure, as muscle tissue requires energy to maintain.
Is BMR the same as resting metabolic rate?
They are similar, but BMR requires stricter testing conditions than standard RMR.
How accurate is an average BMR?
Population averages provide general context but cannot determine an individual’s precise internal metabolic rate.
Should I use BMR or TDEE for calorie intake?
Use TDEE for establishing daily calorie intake targets. BMR serves only as a resting baseline.
Average Basal Metabolic Rate: Practical Calculator Guide
If You Want a Quick Estimate
Use a validated online calculator based on the Mifflin-St Jeor equation to obtain a solid starting baseline.
If You Want Daily Calorie Needs
Multiply your calculated BMR by an appropriate physical activity factor to estimate your TDEE.
If You Are Worried About a Very Low or High Result
Consider your body size, height, and muscle mass first. Consult a doctor or GP if you have genuine health concerns.
If You Want a More Direct Measurement
Seek professional laboratory indirect calorimetry testing if precise metabolic measurements are required.
Recommended Evidence for Further Reading
- National Academies of Sciences, Engineering, and Medicine — Dietary Reference Intakes for Energy
- NCBI — Recommended Dietary Allowances: Energy Expenditure
- J. J. Cunningham, American Journal of Clinical Nutrition — Factors Influencing BMR
- NCBI Endotext — Control of Energy Expenditure in Humans
- NHS — Understanding Calories and Daily Energy Requirements
Final Recommendation
When looking up your average basal metabolic rate, remember that online tools provide estimates rather than exact measurements. Having checked my own numbers on quiet mornings in Manchester, I know how tempting it is to treat a calculated BMR figure as an exact target. Use your BMR as a starting baseline, multiply it by your activity level to find your TDEE, and listen to your body over time. If you have concerns about your metabolism, consult a GP or registered dietitian rather than relying on online formulas alone.

Ehatasamul Alom is a dedicated health-tech enthusiast and the co-founder of BMRCalculator. With a passion for metabolic science, he focuses on providing accurate health data for the UK community. Ehatasamul ensures that every tool and guide aligns with NHS standards and public health research. His mission is to simplify complex biological data, helping British residents make informed decisions about their fitness, calorie needs, and long-term wellness. When not analyzing health trends, he explores the latest innovations in wearable fitness technology.