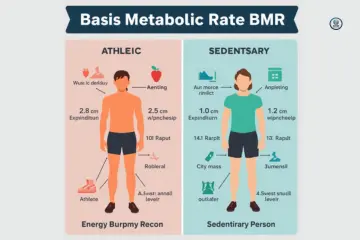
BMR estimates the energy your body needs at rest, while your activity level helps estimate how much energy you use across a normal day. An online BMR calculator normally uses personal data first, then an activity factor or PAL-style method to estimate broader daily energy needs.
During my trip to Manchester last winter, I worked with a local health expert to refine my daily habits. That hands-on session made me realise how much people misread bmr and activity level numbers. Getting these two inputs right gives you a true picture of your daily needs. It stops you from guessing and helps you set realistic targets.
What Is BMR?
Basal Metabolic Rate is the baseline cost of keeping you alive. It forms the core resting layer in calorie tools. It is not a complete sum of what you burn in a full day.
What Does Basal Metabolic Rate Mean?
Your Basal Metabolic Rate is the energy needed for basic life processes. Even if you rest in bed all day, your body works hard behind the scenes.
It powers vital actions:
- Breathing: Expanding and contracting your lungs.
- Circulation: Pumping blood through your veins.
- Organ function: Supporting your brain, liver, and kidneys.
- Temperature regulation: Keeping your body heat steady.
- Cellular activity: Repairing tissue and making proteins.
- Basic physiological processes: Maintaining vital life systems.
What Does BMR Not Include?
Your BMR represents resting energy requirements only. It leaves out all physical movement and basic tasks.
It does not account for:
- Walking: Strolling around your home or office.
- Cycling: Riding to the train station.
- Running: Going for a morning jog.
- Gym sessions: Lifting weights or taking classes.
- Housework: Cleaning, dusting, or washing up.
- Commuting: Travelling to work or school.
- General movement: Fidgeting and posture changes.
- Digesting food: Processing nutrients from meals.
BMR vs RMR
People often see these terms used in health apps:
- BMR (Basal Metabolic Rate): Measured in a lab right after waking up in a fasted state.
- RMR (Resting Metabolic Rate): Measured under less strict conditions with light prior movement.
- REE (Resting Energy Expenditure): The total energy burned at rest over 24 hours.
Online tools often use these terms interchangeably. While testing rules differ in labs, consumer calculators treat them as similar resting baselines.
What Is an Activity Level?
An activity level describes how much physical movement and exercise you get in a normal week.
The key focus is your usual routine. A calculator needs to reflect a normal week, not an active Saturday when you walked 25,000 steps around town.
What Does Activity Level Include?
A true picture of your movement includes:
- Exercise: Planned workouts and sports sessions.
- Walking: Daily steps, commutes, and dog walks.
- Work-related movement: Standing, lifting, or desk work.
- Commuting: Walking to buses or cycling to work.
- Household tasks: Gardening, cleaning, and DIY projects.
- Sport: Recreational games and team matches.
- General daily movement: Fidgeting and casual steps.
Activity Level Is More Than Exercise
A 45-minute gym workout does not describe your whole day. If you sit at a desk for eight hours after that workout, your total movement remains quite low.
Consider two different routines:
- Desk worker: Sits all day but trains for 45 minutes in the evening.
- Retail worker: On their feet for eight hours without formal gym sessions.
The retail worker often burns more total energy across the day through continuous movement.
Why Activity Level Matters in a BMR Calculator
Your BMR provides a resting baseline figure. Adding your activity level adjusts that resting baseline into a full daily energy estimate.
BMR and Activity Level: How They Work Together
Understanding how bmr and activity level interact gives you a clear view of your overall daily calorie requirements.
BMR Is the Starting Point
Your BMR sets the resting baseline:
$$\text{BMR} = \text{estimated resting energy expenditure}$$
This figure covers basic survival needs before any movement takes place.
Activity Level Adjusts the Estimate
Calculators apply an activity multiplier to scale up your resting baseline. This factor reflects your work, walking, and exercise habits.
From BMR to TDEE
Online tools use a simple sequence to estimate your total needs:
$$\text{BMR} \to \text{activity adjustment} \to \text{estimated TDEE}$$
This formula turns your resting energy needs into a practical daily expenditure target.
Why Activity Changes Your Estimated Calorie Needs
Physical movement requires extra energy beyond basic cellular upkeep. Moving more throughout the day increases your overall energy expenditure.
BMR and Activity Level Comparison Table
This practical table outlines how resting needs compare with daily activity inputs. It helps you see how calculators combine both factors.
| Factor | BMR | Activity Level |
| What it describes | Resting energy needs | Usual daily movement |
| Exercise included? | No | Usually considered |
| Walking included? | No | Usually considered |
| Used for TDEE? | Starting point | Major input |
| Fixed for everyone? | No | No |
| Exact measurement? | No, when predicted | No |
Note: Activity factors are helpful estimations. They should not be viewed as exact laboratory measurements.
What Are the Common Activity Levels?
Online tools group daily movement into standard categories. These options help match your weekly habits with an activity multiplier.
Sedentary
This category reflects a routine with minimal movement:
- Mostly sitting at a desk or on the sofa
- Office-based work with minimal standing
- Little to no structured exercise
- Low daily step count
Lightly Active
This category fits light daily routines:
- Regular short walks during the day
- Light exercise or sports 1 to 3 times per week
- Light household tasks and active chores
- Occasional recreational activities
Moderately Active
This category covers balanced movement patterns:
- Frequent exercise 3 to 5 times per week
- Regular daily walking and active commutes
- Active hobbies like cycling or dancing
- Several dedicated workouts each week
Very Active
This category applies to demanding physical routines:
- Physically demanding employment like building or nursing
- Hard exercise or sports 6 to 7 times per week
- High overall step counts every day
- Regular competitive athletic training
Extremely Active
This level applies to professional athletes or heavy manual workers. A single hard gym session does not make an entire week extremely active if you sit for the remaining hours.
Activity Level Table for BMR Calculators
This guide maps common daily routines to standard calculator activity inputs. It offers a practical reference for selecting your input.
| Activity level | Typical routine | Example |
| Sedentary | Mostly sitting | Desk job, little exercise |
| Lightly active | Some regular movement | Walking plus light exercise |
| Moderately active | Regular exercise | Training several days weekly |
| Very active | High movement | Active job plus frequent training |
| Extremely active | Very high demand | Heavy physical work and frequent training |
Note: Multiplier values depend on the specific mathematical formula chosen by your calculator.
How Activity Factors Work
Activity factors use simple multiplication to scale up your resting baseline. Understanding this math clarifies how tools estimate your total daily needs.
The Basic Formula
Calculators use a standard mathematical equation:
This calculation estimates your overall daily expenditure based on average population data.
Example Calculation
Here is how the basic math works:
- Estimated BMR: 1,500 kcal/day
- Selected activity factor: 1.5 (Moderately active)
- Estimated daily expenditure:
This math illustrates how activity factors scale your resting baseline upward.
Why Activity Factors Are Not Perfect
Calculators apply broad population averages. They cannot track every subtle change in your daily movement or local lifestyle.
Limits include:
- Broad activity groups that group different routines together
- Daily shifts in movement between weekdays and weekends
- Differences in exercise effort and workout intensity
- Variations in casual movement like fidgeting
- Natural individual metabolic differences
What Is TDEE?
Total Daily Energy Expenditure is the total amount of energy you burn in a 24-hour window. It combines resting requirements with all physical movement and digestion.
Main Components of TDEE
Your total daily output consists of four main parts:
- Resting Energy Expenditure (REE): Baseline metabolic energy.
- Physical Activity (EAT): Planned exercise and sport.
- Non-Exercise Activity Thermogenesis (NEAT): Casual daily movement.
- Thermic Effect of Food (TEF): Energy used to digest food.
BMR’s Role in TDEE
Resting metabolism forms the largest share of your daily output. For most people, it makes up 60% to 75% of total daily energy expenditure.
Activity’s Role in TDEE
Daily movement accounts for the remaining 25% to 40% of your energy expenditure. It explains why two people with similar resting baselines can have different total needs.
TDEE vs Maintenance Calories
These terms are closely linked in online tools. TDEE is the total energy you burn, while maintenance calories represent the intake needed to keep your weight stable.
BMR and Activity Level vs TDEE
Understanding these four terms makes energy calculations easier to follow:
- BMR: Your resting baseline figure.
- Activity Level: A description of your usual movement and exercise.
- Activity Factor: The numerical multiplier assigned to your activity level.
- TDEE: The final estimated total energy expenditure.
Why These Terms Get Confused
Online tools often place these inputs side by side. Seeing them together can make them seem identical, but each performs a distinct function in the calculation process.
How BMR Is Calculated
Calculators use validated mathematical equations to estimate your resting energy expenditure from key personal traits.
Mifflin-St Jeor Equation
Developed in 1990, the Mifflin-St Jeor equation is widely viewed as a reliable tool for healthy adults. It uses weight, height, age, and biological sex.
Harris-Benedict Equation
Revised in 1984, the Harris-Benedict equation is another common formula. It often yields slightly higher baseline estimates than newer tools.
Why Different BMR Calculators Give Different Results
You may see varying figures across online tools due to:
- Differing underlying equations (e.g., Mifflin-St Jeor vs Harris-Benedict)
- Differences in how algorithms round numbers
- Variations in unit conversions between metric and imperial
- Equations built for specific population groups
- Natural prediction error in mathematical models
Is a BMR Calculator an Exact Measurement?
No. Calculators offer statistical predictions based on broad data. True accuracy requires lab tests like indirect calorimetry, which measures oxygen and carbon dioxide levels.
How Accurate Is an Activity-Based BMR Calculator?
Knowing the limitations of predictive tools helps you use their outputs effectively without expecting absolute accuracy.
Accuracy of the BMR Estimate
Equations predict energy expenditure using general population averages. Studies show that individual factors like muscle mass can cause actual resting needs to vary from predictions.
Accuracy of the Activity Estimate
Selecting an activity category introduces subjective choice. People often overestimate workout intensity or underestimate time spent sitting at a desk.
Why Real Energy Needs Vary
Individual daily energy demands are shaped by:
- Body composition and muscle mass ratio
- Total body size and height
- Age and life stage
- Biological sex
- Daily movement and work habits
- Overall health and medical factors
What Is NEAT and Why Does It Matter?
Non-Exercise Activity Thermogenesis covers the energy burned through all physical movement outside of sleeping, eating, and sports.
Examples of NEAT
Common daily NEAT activities include:
- Walking to the bus stop or train station
- Taking the stairs instead of the lift
- Standing at a high desk or counter
- Carrying groceries home from the shop
- Cleaning, vacuuming, and doing laundry
- Potting plants and working in the garden
- Moving around your home during the day
NEAT vs Exercise
Planned exercise includes structured sessions like running, cycling, or gym classes. NEAT covers casual, unstructured movements throughout your normal day.
Why NEAT Can Change Your Activity Level
NEAT varies significantly between individuals. Two people who follow the exact same workout routine can differ in daily output by hundreds of calories based on casual step counts.
BMR and Activity Level in Real Life
Looking at real-world daily routines clarifies how movement patterns alter total calorie requirements.
A Desk-Based Day in London
Consider a typical desk worker’s routine:
- Commuting by train with brief walks
- Sitting at an office desk for eight hours
- Walking briefly during lunch
- Completing a 30-minute gym workout in the evening
Despite the gym session, sitting for most of the day keeps this overall routine in the lightly active range.
A Physically Active Job in Manchester
Consider a worker with a physically demanding job:
- Standing, walking, and lifting for eight hours
- Carrying equipment across a job site
- No formal gym workouts in the evening
Continuous job movement creates high total energy expenditure, fitting the very active category without formal gym sessions.
A Work-From-Home Day
A remote desk worker who completes a 45-minute morning workout but spends the rest of the day sitting remains largely sedentary overall.
Why Real Life Is Messy
Daily routines change constantly. A simple online calculator cannot account for catching a bus or carrying heavy bags upstairs. It works entirely off the general category you select.
BMR and Activity Level by Age
Age is an input in standard equations, but it should not be used to assume someone’s activity level.
BMR and Activity in Younger Adults
Younger adults often display higher baseline figures. Active work, study routines, sports, and frequent walking keep overall daily movement elevated.
BMR and Activity in Middle Age
As people move through middle age, resting metabolism can drop slightly. Shifts in work demands, commutes, and leisure time often reduce total daily movement.
BMR and Activity After 65
Older adults should not automatically be classed as sedentary. Preserving muscle mass and staying active supports healthy metabolic function.
According to NHS guidance, adults aged 65 and over should aim for daily physical activity. This includes strength, balance, and flexibility exercises on at least two days each week.
BMR and Activity Level for Different Types of Exercise
Different forms of exercise contribute to your weekly activity total in unique ways.
Walking
Walking is an accessible way to raise your daily movement. Brisk walking, active commutes, and longer weekend strolls steadily build total weekly output.
Cycling
Cycling serves as both transportation and exercise. Commuting by bike or riding on weekends raises your weekly activity level.
Running
Running is a vigorous exercise that burns energy efficiently. However, your overall weekly category still depends on your movement during non-running hours.
Strength Training
Lifting weights builds lean muscle mass over time, which supports your baseline metabolism. A single workout should be viewed as part of your broader weekly routine.
Team Sports
Sports like football, rugby, hockey, and netball combine vigorous exercise with regular movement, raising overall weekly activity factor choices.
UK Physical Activity Guidance and BMR
Official health guidelines describe targets for health, while calorie tools use activity factors to estimate energy output.
NHS Guidance for Adults
NHS guidance recommends that adults aged 19 to 64 aim for at least 150 minutes of moderate activity or 75 minutes of vigorous activity weekly. They should also perform muscle-strengthening activities on two or more days.
What Counts as Moderate Activity?
The NHS lists several examples of moderate activity:
- Brisk walking
- Gentle cycling
- Social dancing
- Hiking in the countryside
- Playing doubles tennis
The NHS defines moderate activity as movement that raises your heart rate and breathing while still allowing you to speak comfortably.
Why Meeting the NHS Target Does Not Give You a Calorie Number
Health guidelines focus on cardiovascular and systemic health. Calorie calculators use activity factors to estimate energy expenditure. Meeting health targets does not guarantee a specific numeric output.
How to Choose Your Activity Level in a BMR Calculator
Follow this structured approach to pick the activity factor that best reflects your normal routine.
Step 1: Look at Your Whole Week
Evaluate your total movement across seven days, including work demands, commutes, exercise sessions, and weekend chores.
Step 2: Look at Your Normal Day
Select a category based on your typical routine rather than your most active single day of the month.
Step 3: Consider Exercise Frequency
Review your workout habits:
- How many days per week do you train?
- How long does each session last?
- How intense are your workouts?
- How consistently do you maintain this schedule?
Step 4: Consider Non-Exercise Movement
Factor in daily steps, standing time at work, household chores, and walking commutes alongside formal workouts.
Step 5: Check the Calculator’s Definition
Read the descriptions provided by your calculator, as activity multiplier scales vary between tools.
BMR Activity Level Decision Table
Use this guide to match your normal weekly routine with the most appropriate calculator category.
| Your usual routine | Likely calculator category | What to consider |
| Mostly sitting, little exercise | Sedentary | Low overall daily step count |
| Walking plus some exercise | Lightly active | Regular light movement throughout the week |
| Frequent exercise and walking | Moderately active | Consistent active workouts multiple days weekly |
| Active work plus regular training | Very active | Physically demanding job alongside workouts |
| Heavy physical work plus intense training | Extremely active | Exceptionally high daily movement and physical labor |
Note: If your routine falls between two categories, treat your final calculation as a flexible starting estimate.
Common BMR and Activity Level Mistakes
Avoiding common selection errors helps keep your calorie estimates practical and realistic.
Mistake 1: Using BMR as Daily Calorie Needs
Your BMR represents resting needs only. Eating at your BMR level creates an unintended deficit because it ignores all daily movement.
Mistake 2: Choosing Activity Based on One Workout
A single intense workout does not make an entire week highly active if you spend the remaining hours sitting down.
Mistake 3: Ignoring Daily Walking
Casual walking and NEAT contribute significantly to total energy expenditure. Omitting daily steps can lead to underestimating your activity level.
Mistake 4: Calling Yourself Sedentary Because You Do Not Go to the Gym
Active jobs, walking commutes, and housework generate significant energy expenditure even without formal gym visits.
Mistake 5: Assuming More Exercise Always Means a Proportionally Higher Number
Activity factors rely on broad population approximations. Doubling your workout time does not automatically double your total output.
Mistake 6: Comparing Results Without Checking the Formula
Calculators use different underlying formulas and multiplier scales. Always review the methodology before comparing results.
BMR and Activity Level for Calorie Calculators
Understanding calculator inputs helps you get the most out of online energy tools.
What a Good BMR Calculator Should Ask For
A reliable online calculation tool should prompt you for:
- Age
- Height
- Weight
- Biological sex (where required by the formula)
- Activity level
What a Good Result Page Should Show
A clear result summary should display:
- Baseline BMR figure
- Selected activity category
- Activity multiplier used
- Final estimated TDEE
- Units of measurement (kcal/day)
- Specific equation used
Why Transparency Builds Trust
Showing the underlying formula and multiplier details allows you to verify how your output was calculated.
Calculator UX Ideas
Effective online tools feature:
- Clean, intuitive input fields
- Simple metric and imperial toggles
- Clear activity category descriptions
- Distinct BMR display section
- Clear TDEE output section
- Concise explanations of the mathematical formulas
- Responsive, mobile-friendly design
- Plain-English guidance notes
Expert Advice on BMR and Activity Level
Relying on established research helps put calculator predictions into proper context.
What Mifflin and Colleagues Found
In 1990, M. D. Mifflin and colleagues published landmark research deriving a predictive equation for resting energy expenditure from measured data. Their formula remains a standard in modern nutrition tools.
Why Predictive Equations Need Context
Equations use measurable inputs like height, weight, and age to predict resting needs. However, they remain mathematical models rather than direct laboratory measurements.
What Modern Research Adds
Recent validation studies show that while equations like Mifflin-St Jeor perform well across populations, individual variations in body composition cause differences from actual values.
Expert-Level Practical Advice
- Treat calculated figures as practical starting estimates.
- Be realistic when choosing your activity multiplier.
- Keep BMR and TDEE distinct in your planning.
- Check the mathematical formula behind your chosen tool.
- Adjust your targets based on real-world weight trends over time.
BMR and Activity Level: Three Useful Examples
These fictional profiles show how different daily routines shape activity factor selection.
Example 1 — Desk Worker
- Profile: Sits for eight hours at work, walks short distances, does no formal exercise.
- Selection: Sedentary category.
- Logic: Low overall daily step count and lack of structured exercise keep total output close to resting baseline.
Example 2 — Regular Exerciser
- Profile: Desk-based job, walks 8,000 steps daily, trains at the gym four times weekly.
- Selection: Moderately active category.
- Logic: Regular workout sessions paired with consistent daily steps justify a higher activity multiplier.
See 3rd Example — Active Worker
- Profile: On their feet all day in retail, walks 12,000 steps at work, exercises twice weekly.
- Selection: Very active category.
- Logic: Sustained movement throughout the workday creates high total daily output.
BMR and Activity Level vs Maintenance Calories
Connecting calculator estimates to real-world targets helps you manage your energy balance effectively.
What Are Maintenance Calories?
Maintenance calories represent the daily intake needed to keep your weight stable over time. They equal your total daily energy expenditure.
Why Maintenance Needs Vary
Your maintenance target is influenced by:
- Age and life stage
- Height and body frame
- Total body weight and composition
- Daily activity levels
- Natural metabolic variation
Why a Calculator Is Only a Starting Point
Mathematical equations cannot capture every aspect of human metabolism. Use calculated outputs as initial targets, then refine them based on real-world weight trends.
BMR and Activity Level FAQs
What is the relationship between BMR and activity level?
BMR estimates resting energy needs, while activity level describes usual movement and exercise used to estimate total daily energy expenditure.
What activity level should I choose for a BMR calculator?
Choose the category that best matches your normal weekly routine, including work, walking, exercise, and other movement.
Does exercise increase BMR?
Exercise affects energy expenditure, but a workout should not automatically be treated as a permanent increase in BMR.
What is a sedentary activity level?
It generally describes a routine with mostly sitting and little regular exercise or daily movement.
What is a moderately active lifestyle?
It usually means regular physical activity and exercise, but the exact definition varies by calculator.
Is walking included in activity level?
Usually, yes. Walking is part of daily physical activity and can affect total energy expenditure.
Is BMR the same as TDEE?
No. BMR is a resting estimate, while TDEE includes the energy used across the whole day.
Why do BMR calculators give different results?
They may use different equations, assumptions, units, or rounding methods.
Is a BMR calculator accurate?
It can provide a useful estimate, but predictive equations are not exact measurements for every individual.
BMR and Activity Level: Calculator Checklist
Use this practical checklist to ensure accurate inputs when using an online calculator:
- Enter accurate age, height, and weight values.
- Check which underlying equation the tool uses.
- Choose an activity level based on your typical week.
- Account for daily walking and casual steps.
- Factor in Non-Exercise Activity Thermogenesis (NEAT).
- Keep BMR and TDEE distinct in your planning.
- Verify how the calculator defines its activity multipliers.
- View the final result as an estimate rather than an exact measurement.
- Recalculate your targets when your routine or weight changes significantly.
- Use NHS physical activity guidelines for general health context alongside calorie calculations.
Final Recommendation
Understanding bmr and activity level gives you full control over your daily health choices. BMR sets your baseline, while activity levels adjust that baseline to match your real lifestyle. My personal experience testing tools across the UK shows that keeping things simple works best. Pick your activity level based on your average week, treat the result as a helpful starting guide, and adjust your routine as you track your progress over time.

Ehatasamul Alom is a dedicated health-tech enthusiast and the co-founder of BMRCalculator. With a passion for metabolic science, he focuses on providing accurate health data for the UK community. Ehatasamul ensures that every tool and guide aligns with NHS standards and public health research. His mission is to simplify complex biological data, helping British residents make informed decisions about their fitness, calorie needs, and long-term wellness. When not analyzing health trends, he explores the latest innovations in wearable fitness technology.